By: Bob van der Valk
Dateline: Terry, Montana
- US consumption estimated at 18.76 million b/d in 2012 and 18.88 million b/d in 2013 (EIA)
- Only expected to recover to between 21-22 million b/d through 2035 (EIA)
- Light / medium crude oil imports to US Gulf could be eliminated by 2014/2015 from rising Canadian pipeline deliveries and domestic production
- Heavy crude imports from Venezuela and Mexico should continue in medium term
- January-March crude imports from Venezuela and Mexico were 845,000 b/d and 995,000 b/d respectively
Political developments could influence stability of Venezuelan supply
► USAC (PADD 1) crude imports YTD are 1.5 million b/d, roughly 10% below 2008 levels
► USGC (PADD 3) crude imports YTD are 5.8 million b/d just over 15% below 2008 volume
► US crude stocks (excluding SPR) currently at 387 million barrels – highest level since July 1990
► Total US refinery utilization at 91.9% of capacity – spurred by export opportunities – week ending June 15
► PADD 3 operating at 93.2% and PADD 1 at 81.3% of capacity
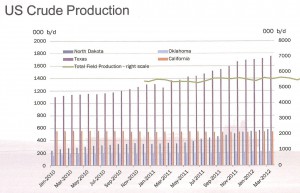
US Crude Oil Production
 ► US crude production expected to 6.3 million b/d in 2012 versus 5.7 million b/d in 2011 (EIA)
► Production currently at 6.26 million b/d – strongest figure since July 1998
► 2013 crude production expected to rise by a further 400,000 b/d
► North Dakota production at 575,000 b/d in March – highest level on record
► Texas crude output at 1.7 million b/d in March up almost 30% year-on-year
► Heavy investment by Shell to start off-shore drilling in Alaska with reserves estimated at around 25 billion barrels further releasing domestic supplies
Bakken Crude Update
►Bakken field in North Dakota expected to produce around 600,000 b/d in 2012 and 650,000-700,000 b/d in 2013 – Breakeven point between US $40 $60 per barrel – WTI basis
► North Dakota rail export capacity increased from roughly 310,000 b/d in 2011 to 470,000 b/d and may be 700,000 b/d by year’s end
► Pipeline capacity at almost 440,000 b/d in Williston Basin (Eastern Montana, North Dakota, South Dakota)
► Bakken crude has approximately US $10/bbl and US $20/bbl discount to spot WTI/Dated Brent providing refiners in all PADDs to incentive gain access to supply
► Crude flows to East, West and Gulf Coasts as rail capacity expands and price differential entices refiners through reduced acquisition cost
► BNSF – controls roughly 75% of North Dakota exports – recently announced US $85 million railroad maintenance & expansion project
Pipeline Updates
► Enbridge to reverse the 240,000 b/d Line 9 pipeline from East to West from Sarnia, Ontario to Montreal
► After regulatory approval and infrastructure maintenance flows to begin spring 2014
► Crude to be sourced from Alberta, Saskatchewan & Manitoba and will primarily consist of light-sweet oil
► Used to feed the Nanticoke refinery (120,000 b/d) and process Canadian crude not foreign imports
► May lead to reversal of Portland, ME to Montreal, Canada pipeline
► Crude from Portland, ME would be required to sail on Jones Act vessels to PADD 1 refineries
► Total flows from Cushing to the USG will total 1.1 million b/d from these projects by 2013
Pipeline Updates
► Seaway pipeline has been reversed since mid-May delivering 150,000 b/d from Cushing, Oklahoma to US Gulf
► Seaway expansion to 400,000 b/d planned to be complete late 2012 / early 2013
► Southern leg of Keystone XL – Gulf Coast Project – construction will begin mid-2012 and should be completed by early 2013
► Gulf Coast Project will deliver crude from Cushing Oklahoma to the US Gulf with a capacity of 700,000 b/d with expansion potentially to 830,000 b/d
► This will eventually be linked to Keystone XL originating in Alberta
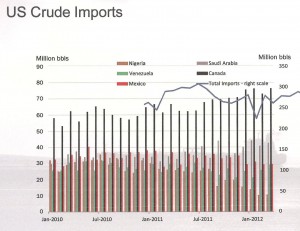
US Crude Oil Imports
 ► Nigerian imports contracted roughly 75% since March 2007 to March 2012 to approximately 10.5 million barrels (340,000 b/d)
► This was roughly 4% of total US imports compared to 10% in 2010
► Reduction in Suezmax requirements (March 2007 to March 2012) was equal to 37 vessels
► Canadian imports rose to highest level on record of 76.4 million barrels (2.5 million b/d) – March 2012
► Imports from Saudi Arabia comparatively steady at 42.5 million barrels (1.4 million b/d) and still constitute around 15% of total import volumes
► Reduced spread between Dated Brent and WTI might help increase the attractiveness of West African grades
The above information was provided by McQuilling Services with additional data obtained from Oil Price Information Service at www.opisnet.com


